The 1 Year report displays the trending data over a year for overall and sectional scores.
Begin by selecting a survey on the top of the filter bar.

Use the Date selector to set the start month for the report. The data will be generated for the next 12 months from the date you selected.
The Show Only Shops In filter allows you to limit the data being displayed by Levels, Groups and Waves. These filters can be used together or individually to match the generated data to your requirements.
The Graph settings control whether to display the data in a line or bar graph type. You can also choose to include the Sectional Scores on the graph.
| Line Graph | Bar Graph |
|---|---|
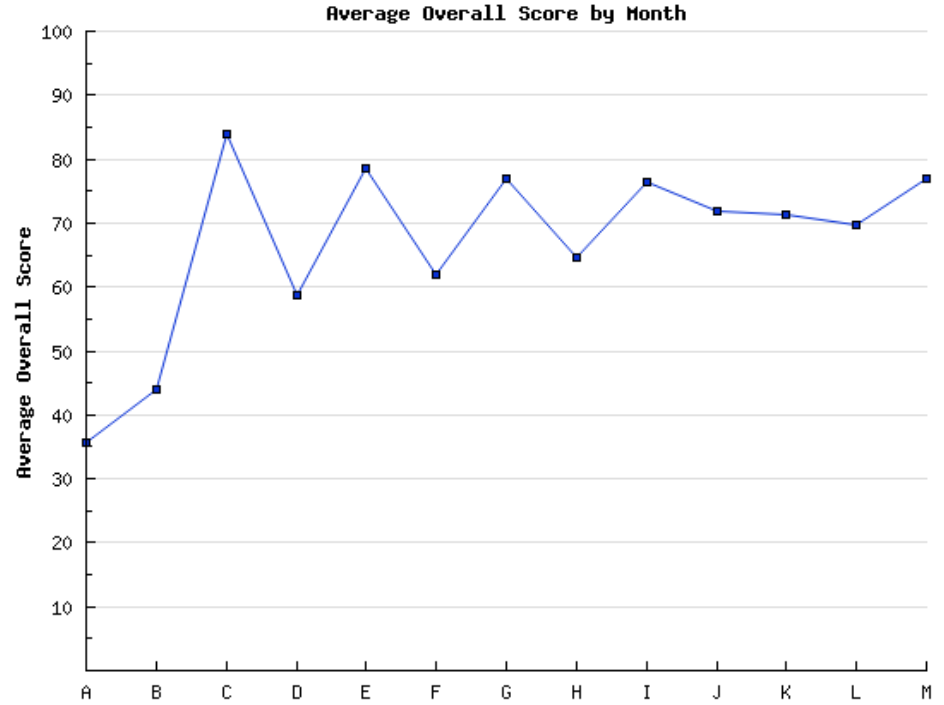 | 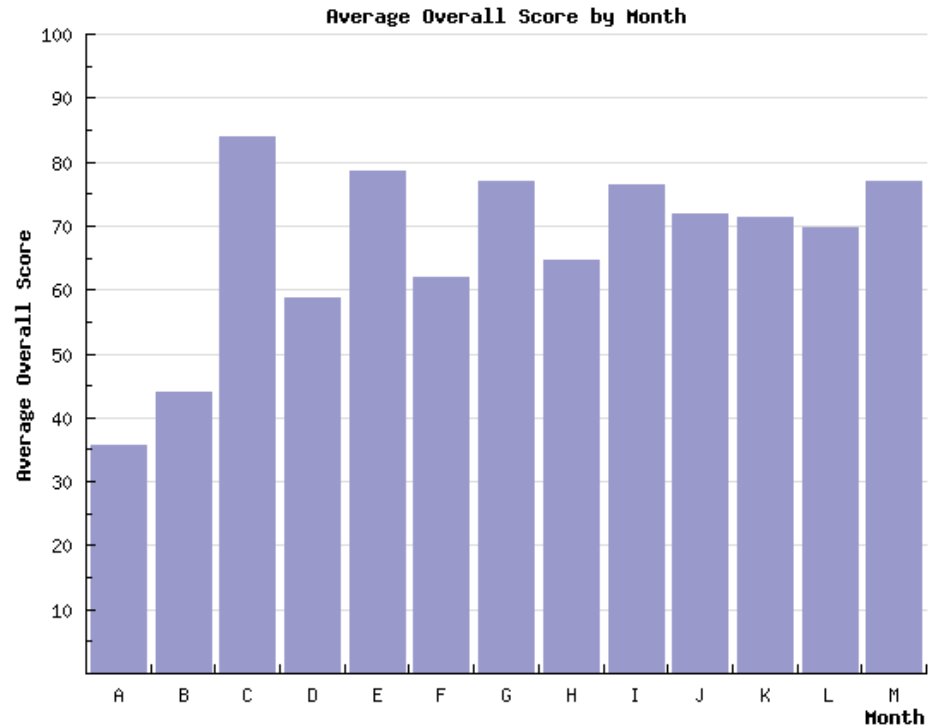 |
If the data is tightly clustered, use the Scaling setting to reduce the white space on the graph and zoom into the data points.
If needed, use the Additional Text box to input and display customized text below the report.
Once satisfied with the filters, use any of the buttons below the input box to generate the report. You can read more about each here.